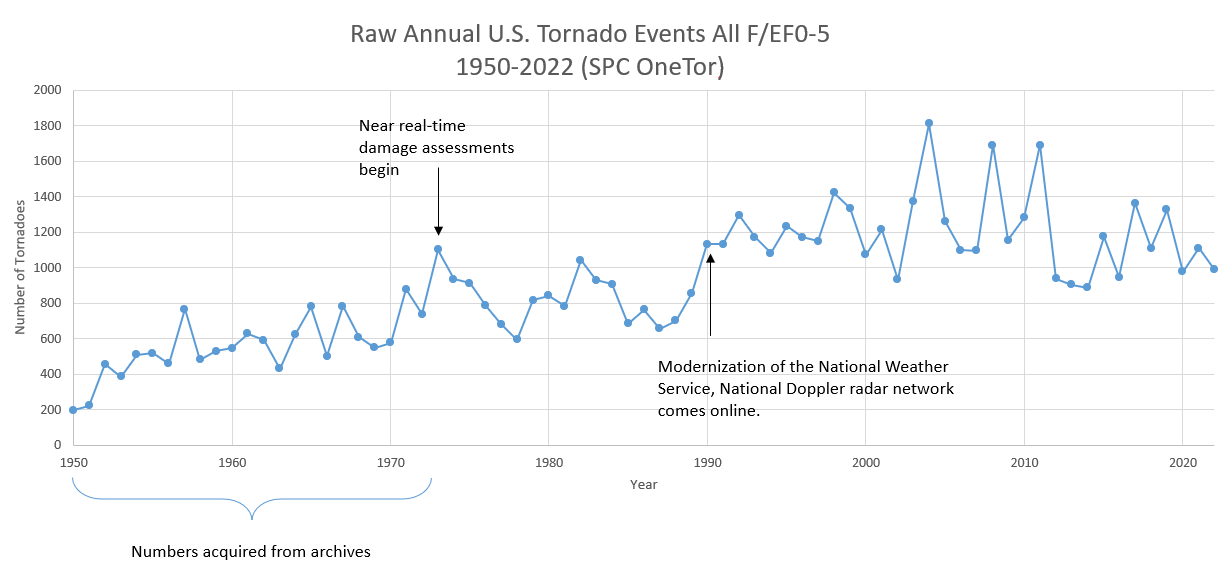
Raw annual tornado counts for all tornadoes from 1950-2022. Note the jumps in trends between the pre and post-1972 era and again before and after the implementation of the WSR_88D radar network in 1990.
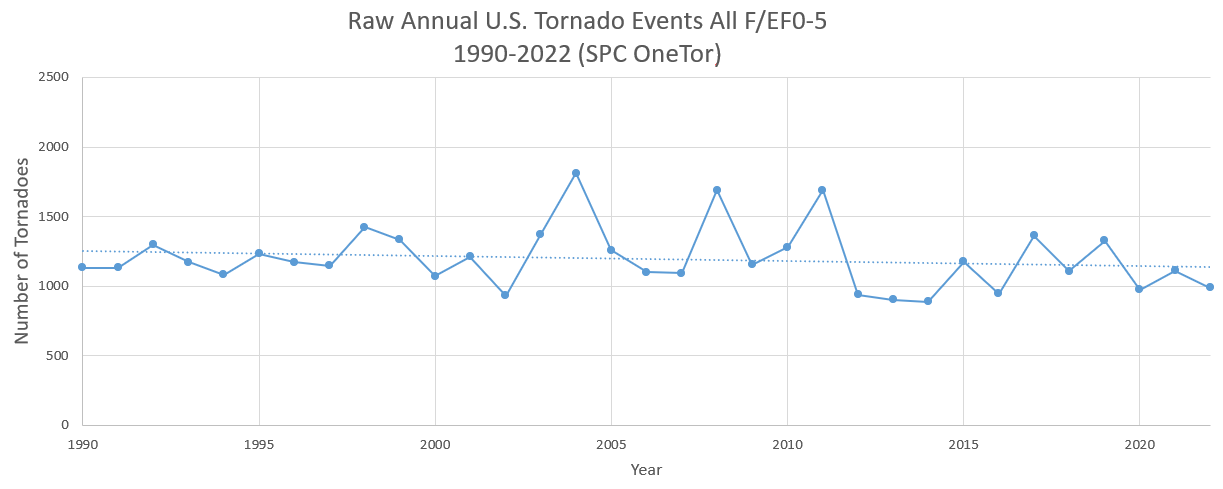
Modern-era tornado reports after the 1990 modernization of the NWS, and the implementation of the national WSR-88D radar network. Annual tornado counts for all tornadoes F/EF0-F/EF5. Note the weakly negative trendline indicating an overall decline in the numbers.
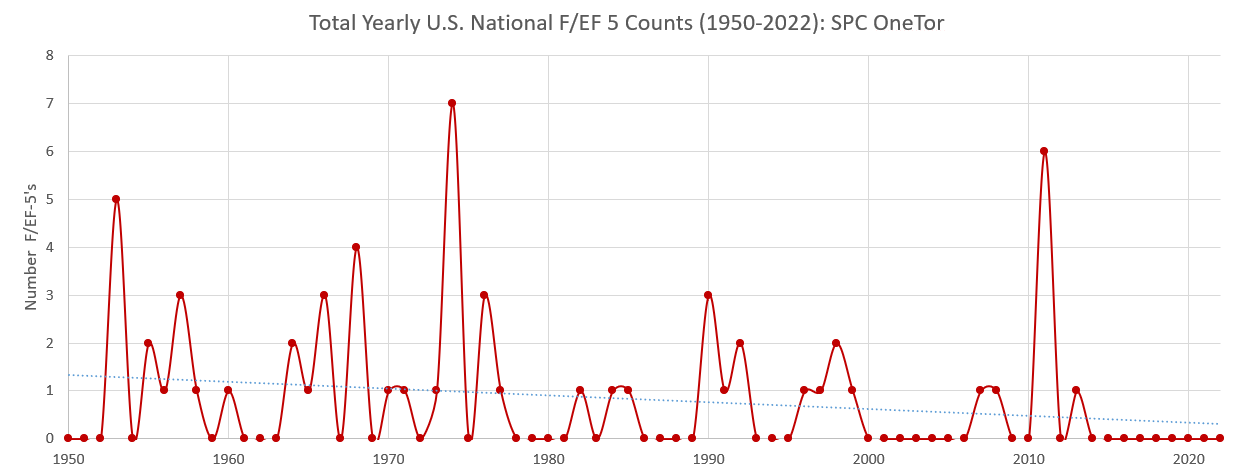
Total number of F/EF 5 tornadoes per year from 1950-2022. These events are incredibly rare, but there is an overall downward trend with time.
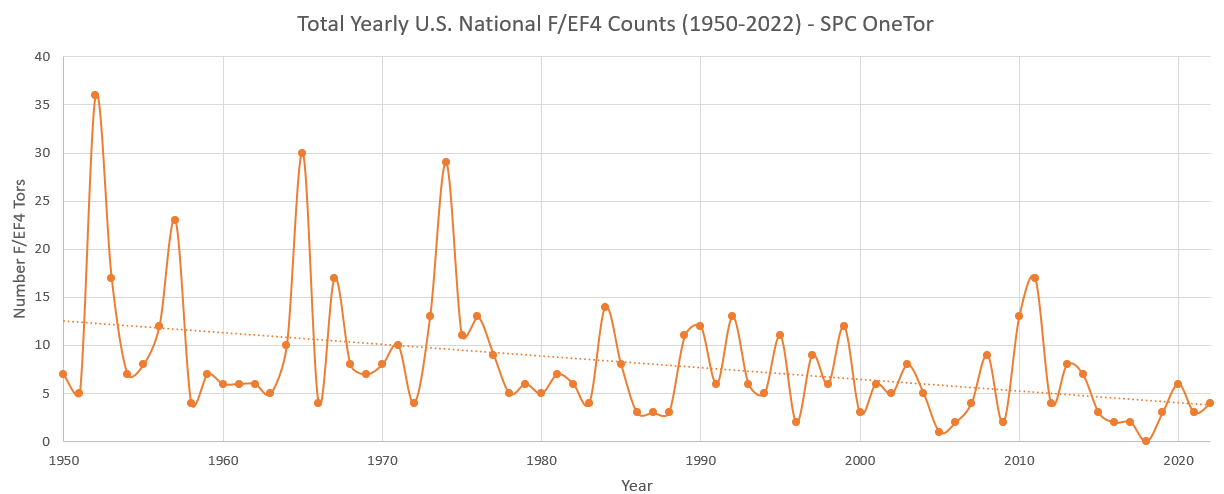
Same as previous except for F/EF4 tornadoes.
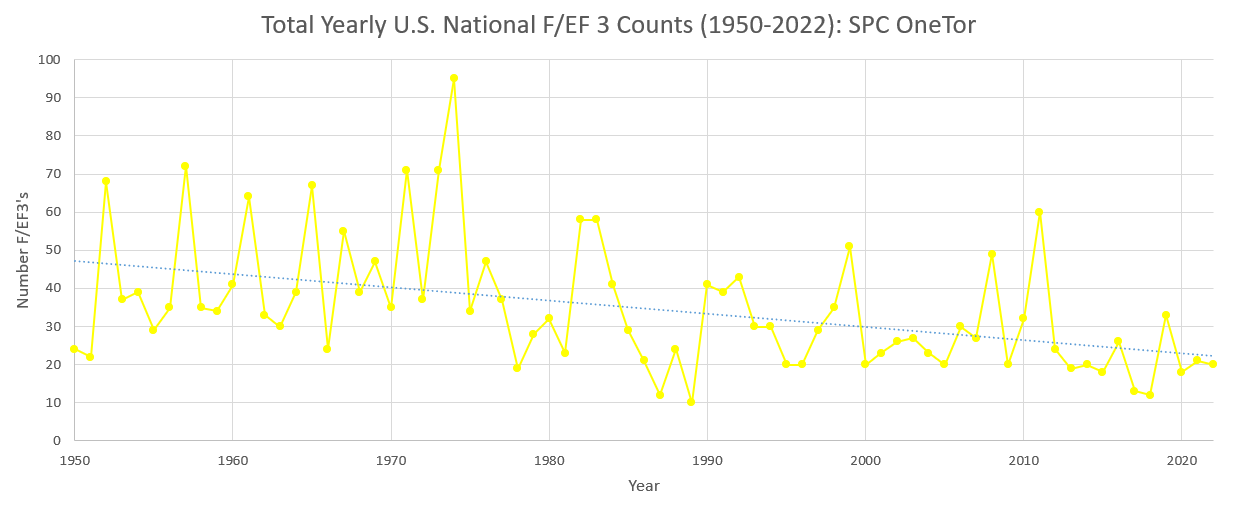
Same as previous except for F/EF3 tornadoes.
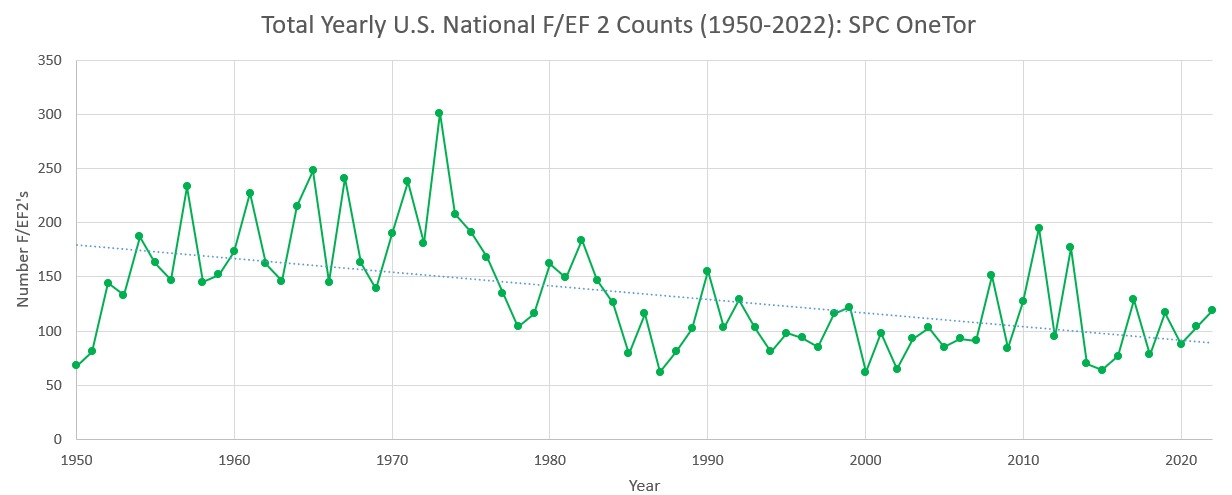
Same as previous except for F/EF2 tornadoes.
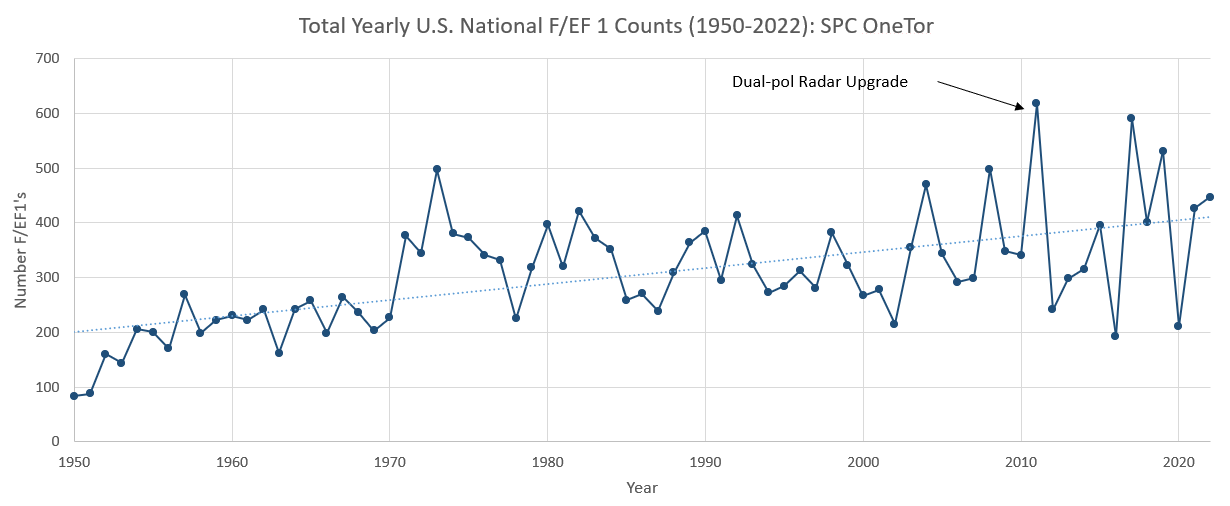
Same as previous except for F/EF1 tornadoes. Note, however, that there is now a positive trend to the tornado events. This is largely a result of underreporting of F1 tornadoes prior to 1972, coupled with an increased ability to identify weak tornadoes shown in Doppler velocity data post 1990, and in dual-polarization data after the dual-pol upgrade to the WSR-88D network in 2011.
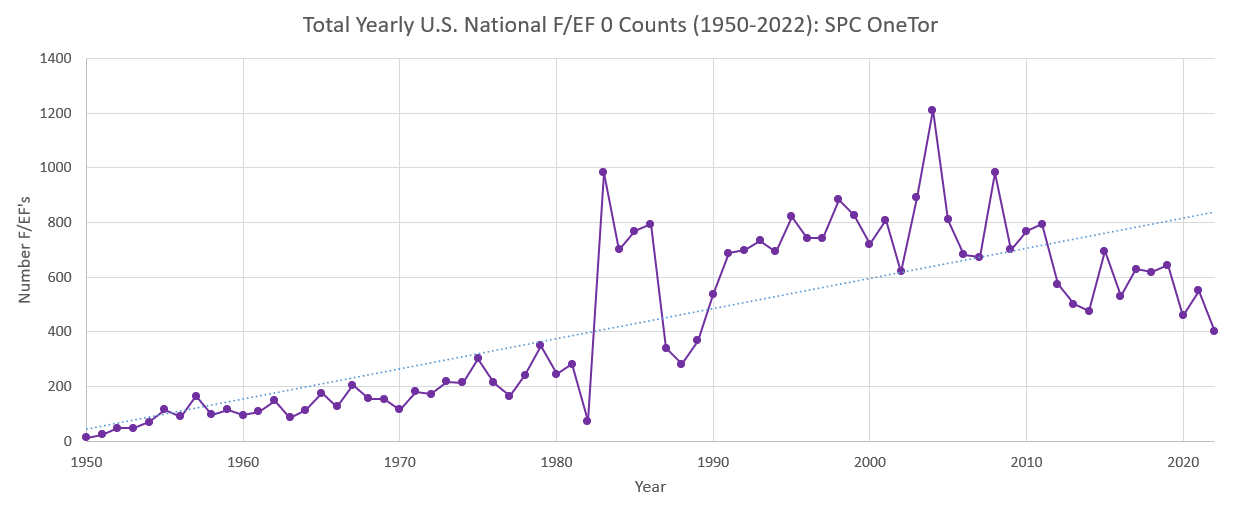
Same as previous except for F/EF0 tornadoes. Again, note the similar positive trend as noted in the F/EF1’s.